Know which facilities need attention before the next hazard update
Exposure Watch checks your public facility footprint against wildfire, flood, storm, heat, air-quality, and earthquake feeds, then ranks exposed locations by urgency, evidence, and operational impact. No PHI. No patient data. No emergency-response instructions.
- Exposed facilities in your public footprint
- Nearest active hazards and severity signals
- Source evidence your team can review
Get your free exposure check
Email us your organization name (or facility list) and we run your free exposure check against live public hazard feeds — you get back exposed locations, source evidence, and a sample monitoring view.
Check my facilitiesReplies same business day. Public data only. No PHI, no patient or clinical data.
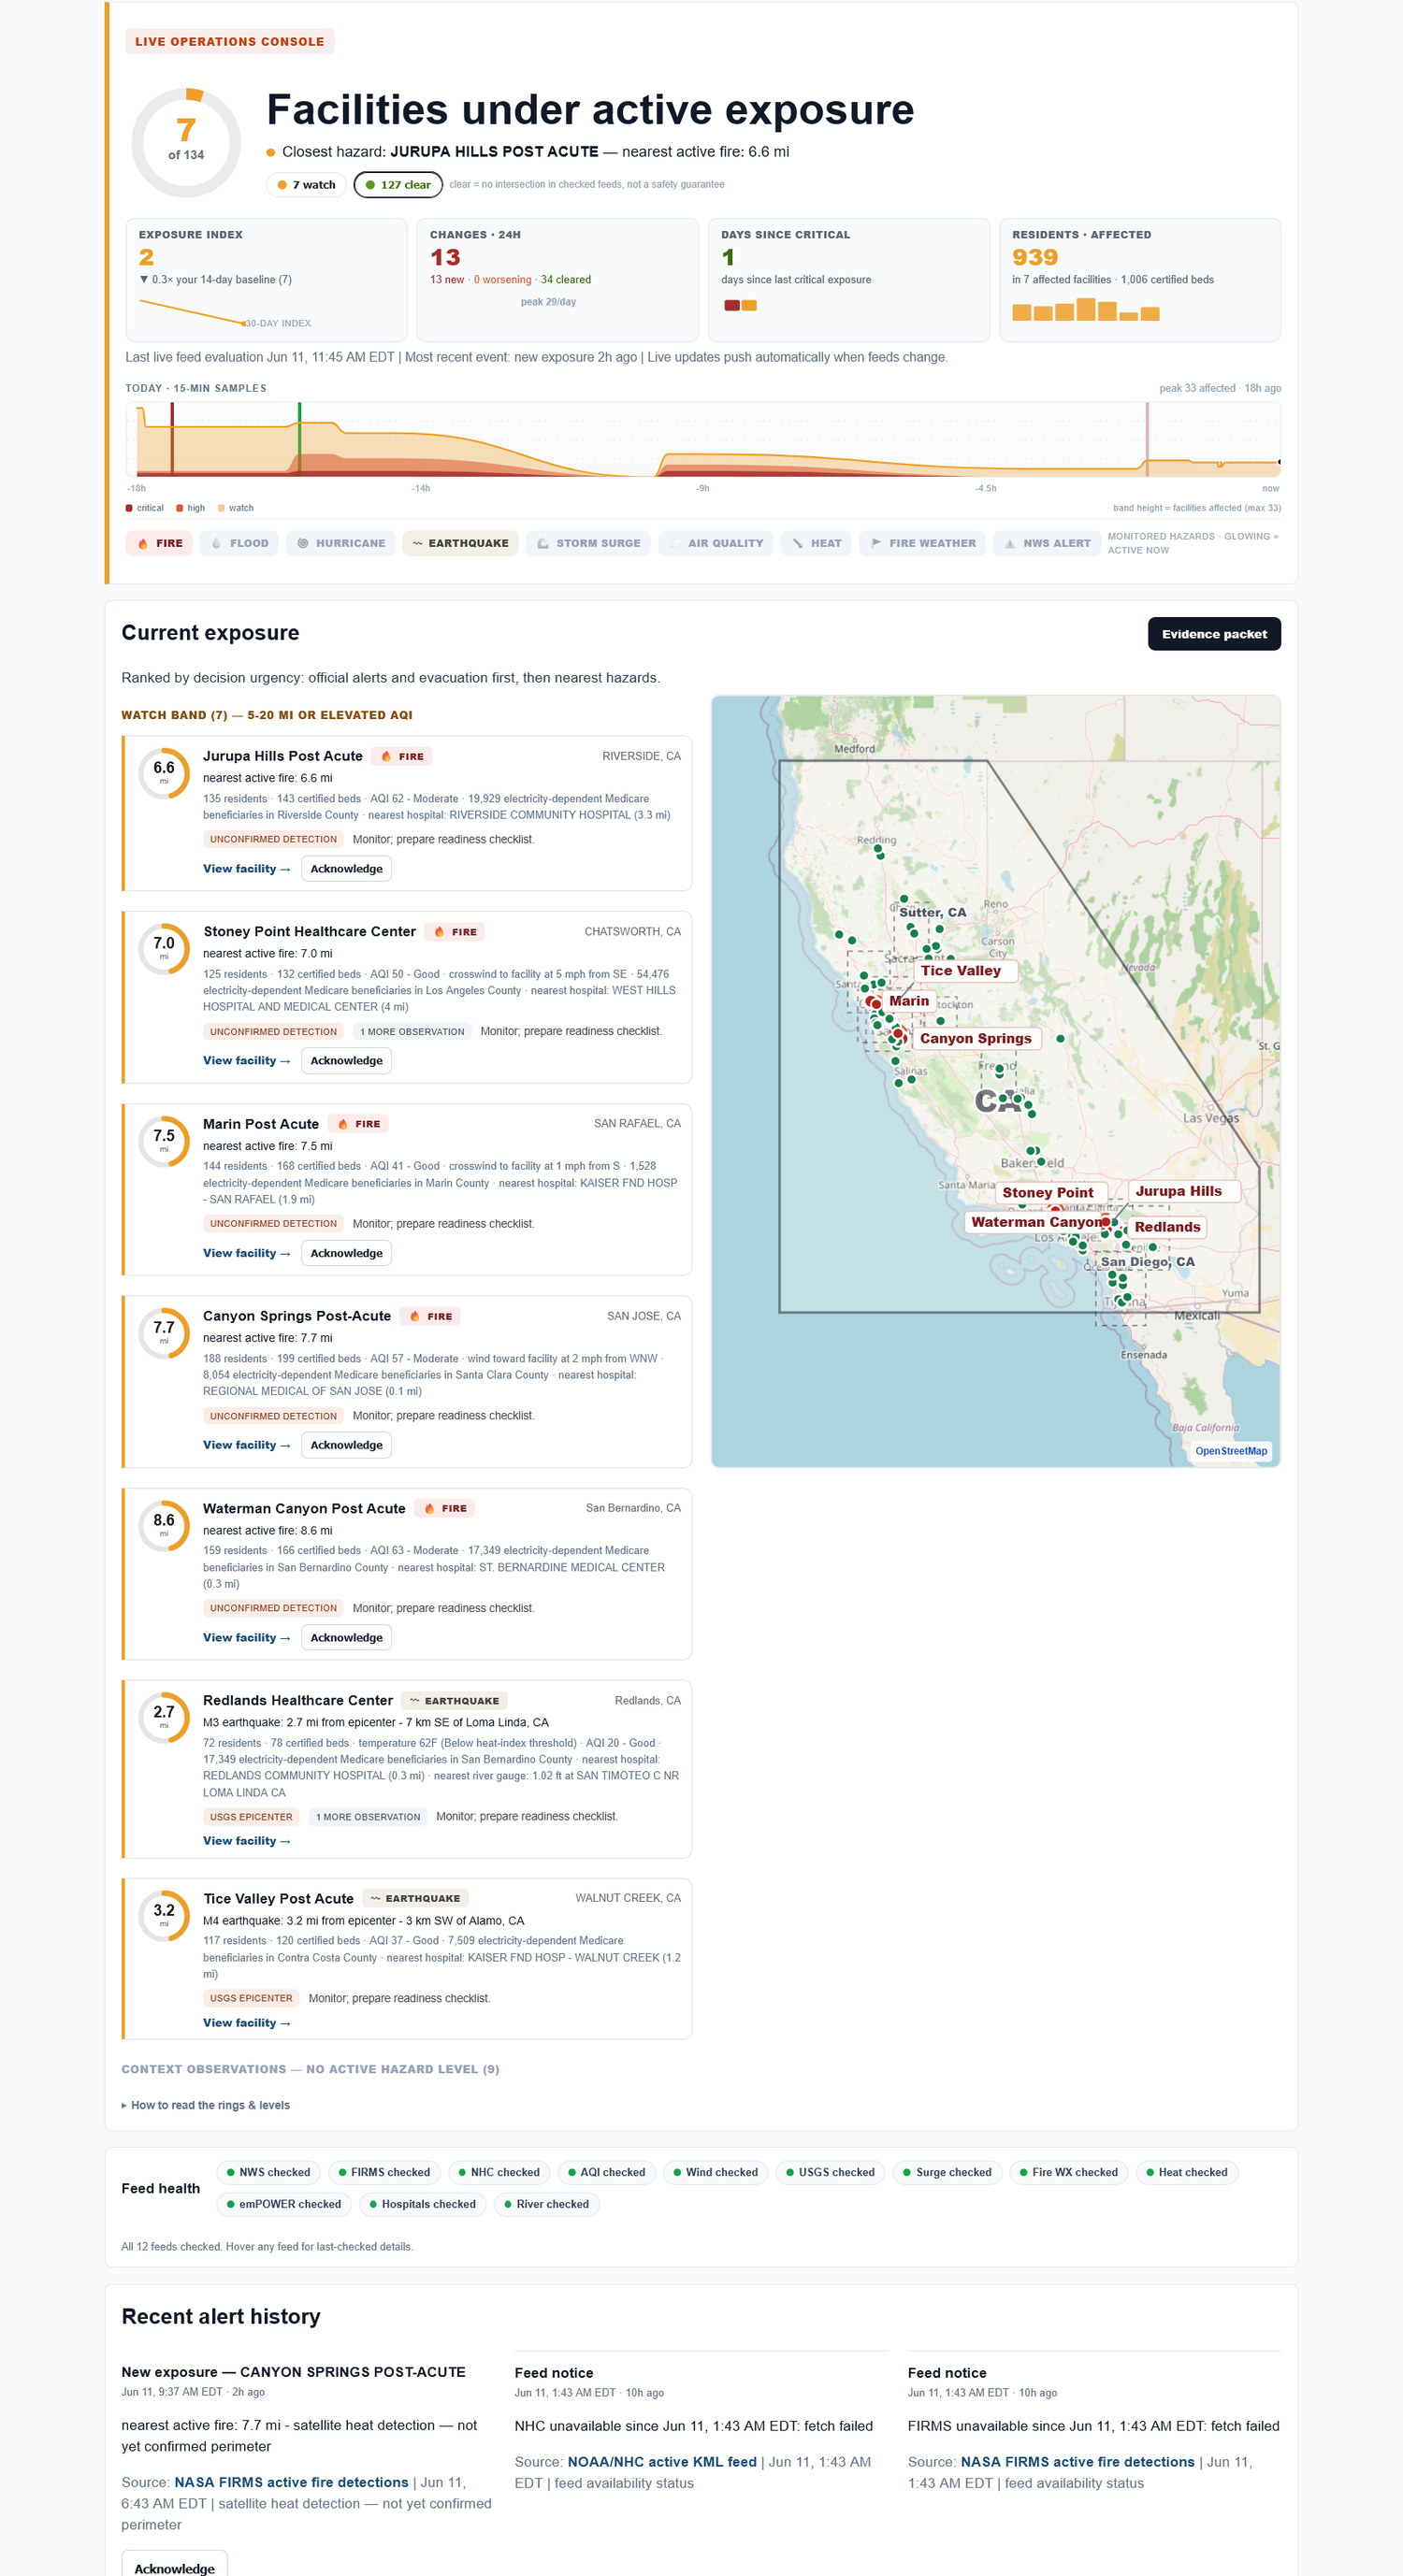
Example output from a real monitoring run
After we match your organization to public facility records, this is the kind of view your team receives: exposed locations, nearest active hazards, evidence labels, map context, alert history, and exportable packets.
7 of 134 facilities exposed · Worst: Jurupa Hills Post Acute — nearest active fire 6.6 mi
 12345
12345
What you are looking at
- 1Answer first: how many facilities are exposed right now, your single worst facility, and the severity mix — before any scrolling.
- 2The day in numbers: exposure index vs your own baseline, 24-hour changes, days since critical, residents in affected facilities — plus a live intraday trace of the day unfolding.
- 3Every exposed facility, ranked by decision urgency, with sourced observations: distance, hazard type, beds, residents, nearest hospital. Every line carries its source and precision label.
- 4Your footprint on a live map, linked to the list — hover a facility card and its dot lights up. Affected facilities are labeled; quiet ones stay quiet.
- 5The audit trail: every alert sent, acknowledged, and resolved, timestamped — and the evidence packet for surveys and HVA reviews, one click away.
Why operators use this
- Find exposed facilities before the daily scramble
- Rank locations by urgency instead of checking every feed manually
- Keep evidence for compliance, internal review, and escalation
- Give regional and facility teams one shared view
- Monitor public hazard feeds without collecting patient data
What monitoring adds
Once monitoring is active, Exposure Watch keeps your saved facility footprint checked against public hazard feeds around the clock, alerts your team when exposure changes, and preserves the evidence trail for review.
- Alerts the moment exposure starts or worsens — email to your on-call list
- 30-day trends, exposure index, and 24-hour change tracking
- Acknowledgment audit trail for compliance and after-action review
- Evidence packet export from any view, any time
Questions buyers ask first
Is this the product?
Yes — this is the same console paying customers use, captured during a real event. Monitoring unlocks live feeds, alerts, trends, and evidence export for your own footprint.
Does this collect member or account data?
No. This vertical will use verified public branch points only - no member records, no account data. Exposure Watch uses public and operational data only.
Is this life-safety guidance?
No. It does not replace emergency response or life-safety instructions. Exposure Watch provides decision support from public data sources.